by Michele
Are you one like me that have been using excel sheets and pivot tables for years, waiting for reports extractions every Friday evening or, when available, every evenings, working for hours to compare X and Y variables and putting them on diagrams, pies and trends?
Welcome in the Advanced Data Visualization revolution.
I do not want to talk about Business Intelligence softwares that require huge skills and investments, I am not an IT guy. I am a business man working with any type of information that can help me in taking decisions.
IT talks about Big Data, Business talks about Huge amount of Data, but Information has a value only when it is given at the right time and in the right way. That’s the point.
Real-time data, different information correlation, user-friendly interfaces, graphics that can match more than 2 or 3 variable at a time, visualize the business: that’s what we need … now!
I am not a (High Performing) computer, I am a human being. A picture can provide much more information of many tables full of numbers.
Data Visualization means: to know, decide, share, forecast, innovate.
Some figures? From an IDG recent study (*) 77% of users sees benefits in optimizing the decision process, 44% sees more speed and accuracy, 41% take advantage from sharing information, 34% registered a ROI increment and 15% of CTO had less pressure from the company users.
How can I get the information from? With which tools? Should I do it by-my-self or IT can help me?
The answer is YES, IT can help.
Any information I need is already there, in my Data Center, but it is a digit. The IT can transform it in a valuable information with Advanced Visualization tools and forward it to the right users with the same approach.
Than any user can “visually explore and interact” with his data in conjunction of his needs and analysis.
I want to close this blog with a sentence from a CTO I recently spoke with: “with Data Visualization finally the Board has understood what IT is and what value (IT) can provide today”.
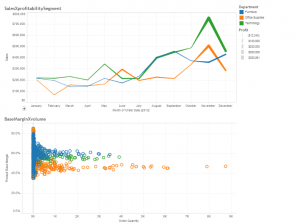
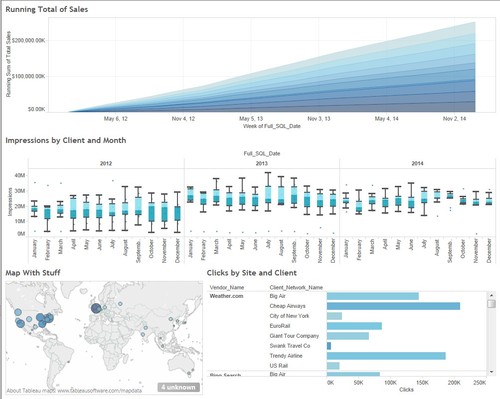
Need some examples?

Want to see more? http://www.tableausoftware.com/learn/gallery
Have fun!